Emergency Response Allocation: California
Combined severity-weighted p-median facility location with a LightGBM spatiotemporal risk ranker to optimize Emergency Response Center placement and hourly accident risk deployment across California, delivered as a live two-track decision-support dashboard.
Problem
Emergency response planning faces two distinct but related resource allocation problems. Long-term: given a fixed budget of Emergency Response Centers (ERCs), where should they be permanently located to minimize response time to accidents across California? Short-term: given a dynamic accident risk landscape, which grid cells should dispatchers prioritize this hour?
Most prior work solves one or the other. Standard spatial clustering approaches (K-Means) minimize geometric compactness, not operational response time. Predictive risk models frequently stop at predictions without producing actionable deployment queues. This project addresses both gaps together, using 1.67 million California accident records from the US Accidents dataset (2016–2022).
The intended users are non-specialist public safety planners at agencies like CHP, Caltrans, and EMS dispatch — people who need clear decision support, not algorithmic detail.
Approach
Data pipeline. The raw 7.7M-record national dataset was cleaned to 7.4M records, then filtered to California (1.67M accidents, ~22.5% of national). Fields with >25% missingness or confirmed as placeholder (End coordinates, Distance, Wind Chill, Precipitation) were dropped. California was discretized into 0.1-degree grid cells (~11 km), and a chronological train/test split was made at 2022 — all pre-2022 data for training, 2022 onward for testing.
Key EDA findings that shaped modeling: accident demand peaks sharply at weekday rush hours (7–9 AM, 3–6 PM, Friday highest); demand is geographically concentrated in the LA Basin and Bay Area along major highway corridors; severity is heavily skewed to level 2, but severity 4 incidents have the highest median duration and impose disproportionate operational burden, motivating severity-weighted demand.
Model 1: Severity-Weighted P-Median ERC Placement.
The placement problem is formulated as a p-median facility-location problem on a road-network travel-time graph:
minimize over F ⊆ D, |F| = k: Σᵢ wᵢ · min_{j∈F} tᵢⱼ
where wᵢ is severity-weighted demand at grid cell i and tᵢⱼ is OSMnx road-network travel time. This directly optimizes what matters operationally — travel time — rather than spatial compactness.
Implementation: grid cells with fewer than 20 accidents are dropped; each remaining cell is represented by its centroid weighted by summed severity. The road network is built from OpenStreetMap (motorway through tertiary roads) using OSMnx. Shortest-path travel times are computed via Dijkstra’s algorithm. A greedy construction phase selects facilities one at a time by marginal improvement, followed by Teitz-Bart swap refinement. The baseline is severity-weighted MiniBatch K-Means on the same demand points and travel-time matrix.
Model 2: LightGBM Spatiotemporal Risk Ranker.
For each grid cell c and hour t, the binary target is y(c,t) = 1 if any accident occurs, 0 otherwise. The primary evaluation metric is Recall@Top-K: of all cells where accidents actually occurred in a given hour, what fraction are captured in the top-K ranked cells?
Features combine three groups: historical risk (cell_rate, cell_how_rate, neighbor_rate); recency signals (rec_1h, rec_6h, rec_24h); and temporal encodings (sine/cosine of hour, day-of-week, month; rush-hour and weekend indicators). Class imbalance is handled with negative sampling (20 negatives per positive per hour) and scale_pos_weight = 20. Evaluation is on all cells without sampling.
Results
Model 1 (ERC Placement):
| Metric | P-Median k=10 | K-Means k=10 | P-Median k=100 | K-Means k=100 |
|---|---|---|---|---|
| Weighted Mean (min) | 26.1 | 33.4 | 7.4 | 11.0 |
| Weighted P95 (min) | 84.0 | 94.2 | 29.4 | 27.1 |
| Coverage ≤ 10 min | 18.3% | 10.1% | 71.5% | 63.7% |
| Coverage ≤ 15 min | 37.5% | 23.0% | 84.9% | 83.9% |
P-median consistently outperforms K-Means on mean travel time and threshold coverage across all values of k. At k=10, 10-minute coverage nearly doubles (10.1% → 18.3%) and mean travel time drops by 7 minutes. The one exception is P95 at k=100 where K-Means is marginally lower — but p-median delivers stronger average accessibility and threshold coverage, which are more operationally relevant.
Model 2 (Risk Ranker):
| Metric | Baseline | LightGBM | Delta |
|---|---|---|---|
| Recall@Top-10 | 0.128 | 0.134 | +0.006 |
| Recall@Top-50 | 0.371 | 0.383 | +0.012 |
| Recall@Top-100 | 0.514 | 0.532 | +0.018 |
| Recall@Top-1% | 0.247 | 0.253 | +0.006 |
LightGBM beats the historical-rate baseline at every cutoff. The largest gain is at Top-100 (+0.018), where the model’s ability to capture nonlinear interactions between location, time, neighboring risk, and recency matters most. HitRate@Top-10 = 0.872 and HitRate@Top-100 = 0.989 mean that for virtually any test hour, at least one true accident cell appears in the top 100.
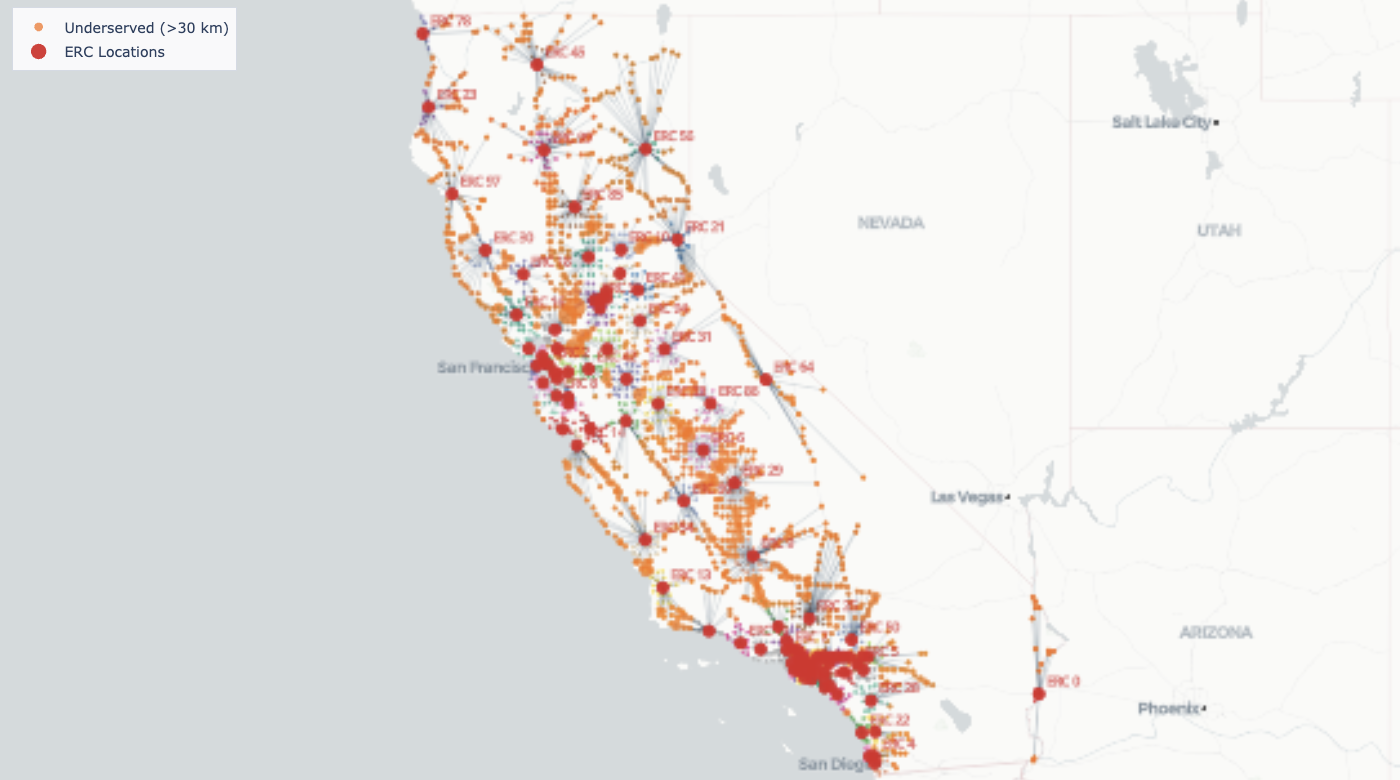
Dashboard. The live dashboard at erc-dashboard.onrender.com exposes both models through two tracks. Track 1 (Strategic Placement) lets planners compare p-median vs K-Means across k values, visualize ERC assignments and underserved cells (>30 km from nearest ERC), and inspect travel-time distributions and load balance. Track 2 (Dynamic Risk) lets dispatchers select a day/hour and top-K size to get a ranked deployment queue with per-cell risk scores, persistent hotspot maps, and a day-hour risk heatmap.
The highest-impact future improvement is linking the two tracks: overlaying the hourly top-K risk cells onto the static ERC placement to compute a dynamic risk coverage metric — what fraction of predicted accident risk falls within target travel time of an open ERC.