Voyla! Database Design: OLTP, OLAP, and Analytics Pipeline
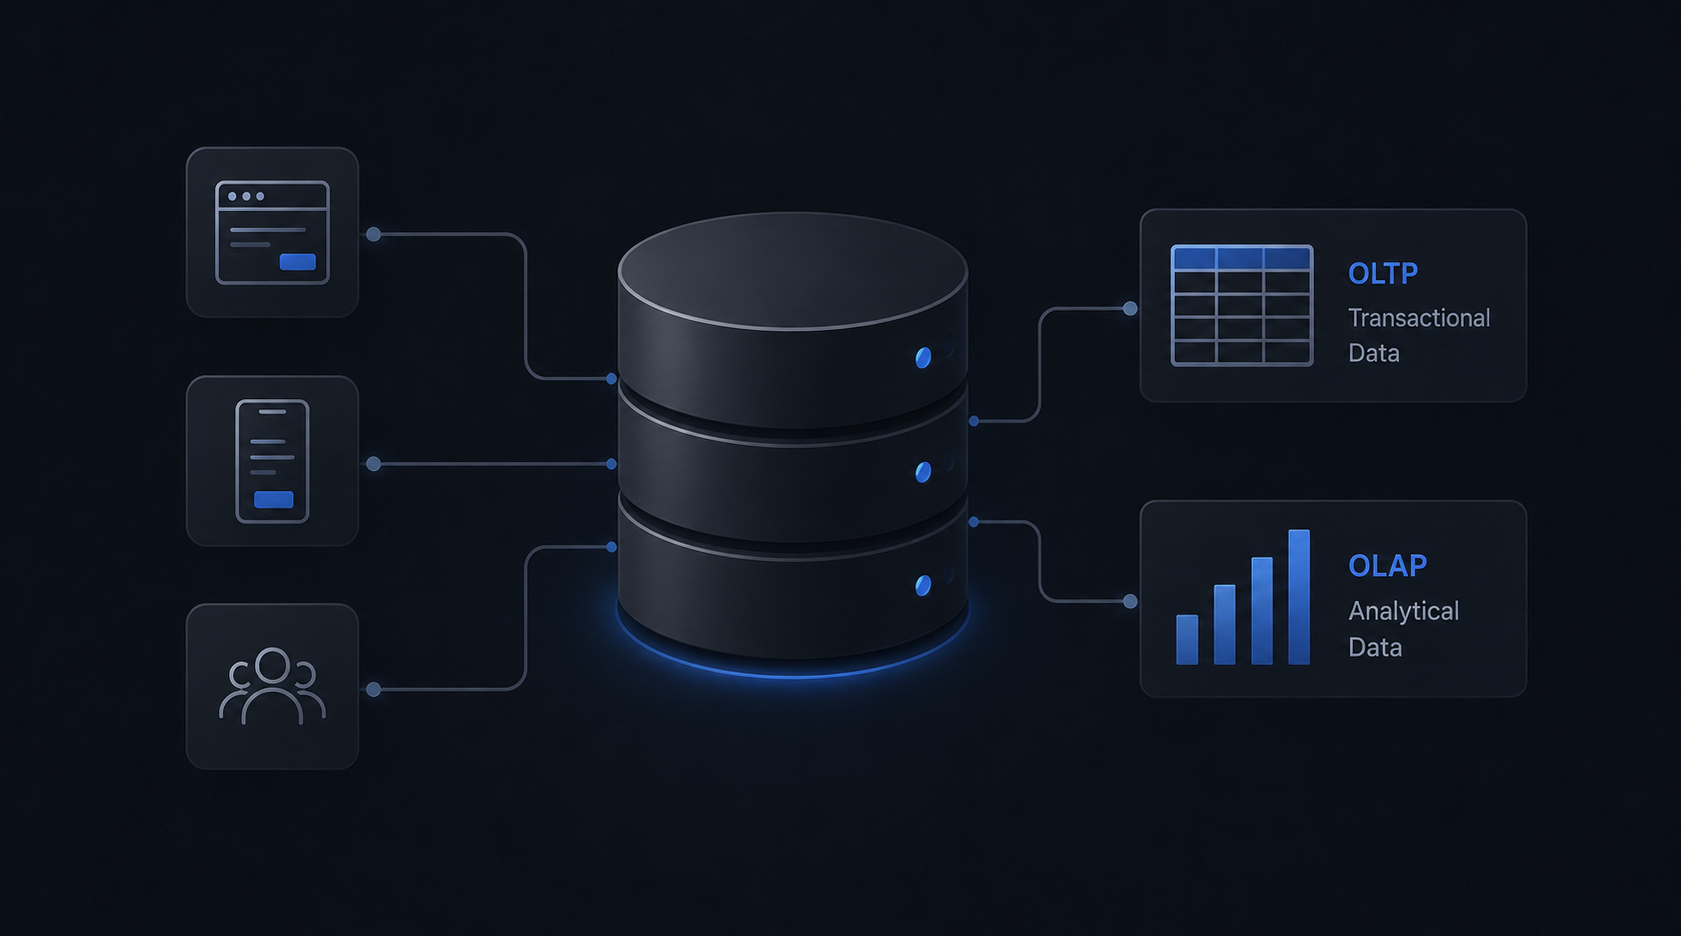
Designed and implemented a full database stack for an AI travel recommendation startup — PostgreSQL OLTP (3NF), Python ETL pipeline, star-schema OLAP warehouse on Azure, Databricks/Spark analytics, and a Streamlit dashboard — processing 172,644 real user interactions across 53,520 locations.
Context
Voyla is an AI travel recommendation app that converts a user’s saved Instagram posts, Threads content, and Google Maps pins into personalized destination and restaurant recommendations. The production database held 4,322 users, 172,644 interactions, and 53,520 locations at the time of analysis, with heavy geographic concentration in Taiwan (41%), Japan (24%), and Hong Kong (8%).
The project — completed as part of UC Berkeley INDENG 215 — covered the full database lifecycle: OLTP design, ETL pipeline, OLAP warehouse, and analytics layer.
OLTP Design (PostgreSQL, 3NF)
The transactional schema was built around 10 tables: 5 core entity tables (users, places, contents, tags, property_mapping) and 5 junction tables (user_places, user_contents, content_places, place_tags, place_properties) to handle many-to-many relationships cleanly.
Design choices: UUID primary keys throughout to avoid collision risk in distributed inserts; strict 3NF normalization to eliminate update anomalies in the tagging and property systems; and a property_mapping abstraction layer allowing new place attributes (cuisine type, price tier, accessibility flags) to be added without schema changes. Target SLA was 50–200 TPS with sub-100ms query latency on core read paths.
ETL Pipeline (Python)
The ETL used a drop-and-reload strategy rather than incremental CDC — appropriate for the data volume and update cadence. Structure: extract.py pulls from OLTP via psycopg2, transform.py applies column mapping and type coercion per a config.py manifest, load.py bulk-inserts into the OLAP target.
ThreadPoolExecutor handled parallel table extraction to cut wall-clock time. The config-driven mapping layer meant adding a new dimension table required only a config change, not code edits.
OLAP Warehouse (Star Schema, Azure PostgreSQL)
The analytical schema collapsed the 10-table OLTP model into 5 tables: 4 dimension tables (users, places, content, property) and 1 central fact table (interactions, 172,644 rows). INTEGER surrogate keys replaced UUIDs for join performance. Hosted on Azure Database for PostgreSQL.
The star schema was sized to support the Streamlit dashboard’s query patterns without pre-aggregation — all five dashboard tabs query the fact table directly with dimension joins.
Streamlit Dashboard
Five-tab dashboard connected directly to the OLAP warehouse:
- Overview — total users, locations, interactions; monthly growth trend
- User Segmentation — engagement intensity distribution, power-user cohort breakdown
- Geographic Expansion — location density by country/region, expansion opportunity heatmap
- Monthly Growth — interaction volume timeline; November 2025 showed an 11x growth spike
- Cohort Retention — M1 retention at 41.3%; stabilizes to 25–27% by M3
Databricks / Spark Analytics
OLAP tables were loaded into Databricks as Delta tables and analyzed with Spark SQL. Four analyses:
Content Engagement — daily interaction timeline and content-type breakdown. Confirmed the November 2025 spike was organic (not a data artifact) and driven disproportionately by place-save interactions.
User Engagement Intensity Prediction — Logistic Regression (3-class) classifying users as low, medium, or high engagement based on interaction history. Features: total interactions, unique places saved, recency. Output used to identify users at risk of dropping to low engagement before they churn.
User Similarity Matrix — Jaccard similarity over place-save sets for all user pairs. 342 user pairs exceeded the similarity threshold, forming the basis for a collaborative filtering recommendation layer.
Place Co-occurrence — Jaccard similarity over co-save patterns across users, surfacing 127 tight location clusters (Jaccard > 0.9). Network graph visualization identified anchor locations that appear across multiple clusters — strong candidates for featured placement in the recommendation feed.
Results
| Metric | Value |
|---|---|
| Users | 4,322 |
| Locations | 53,520 |
| Interactions (fact table) | 172,644 |
| M1 cohort retention | 41.3% |
| M3 cohort retention | 25–27% |
| High-similarity user pairs | 342 |
| Tight place clusters (Jaccard > 0.9) | 127 |
| Nov 2025 MoM growth | ~11x spike |
The geographic skew (Taiwan + Japan + HK = 73% of locations) also surfaced a product insight: Voyla’s content graph is deep in East Asia but thin elsewhere. Any expansion into Southeast Asia or Europe starts from near-zero location density — a cold-start problem the similarity and co-occurrence models could help address as new saves accumulate.